ચિત્ર:English dialects1997.svg

Size of this PNG preview of this SVG file: ૨૬૯ × ૨૬૦ પિક્સેલ. અન્ય આવર્તનો: ૨૪૮ × ૨૪૦ પિક્સેલ | ૪૯૭ × ૪૮૦ પિક્સેલ | ૭૯૫ × ૭૬૮ પિક્સેલ | ૧,૦૫૯ × ૧,૦૨૪ પિક્સેલ | ૨,૧૧૯ × ૨,૦૪૮ પિક્સેલ.
મૂળભુત ફાઇલ (SVG ફાઇલ, માત્ર ૨૬૯ × ૨૬૦ પીક્સલ, ફાઇલનું કદ: ૧૨ KB)
સારાંશ:
| વર્ણન |
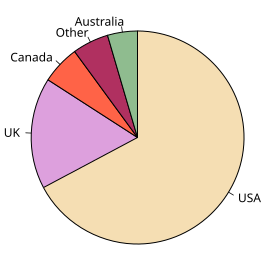
English: Pie chart showing the relative numbers of native English speakers in the major English-speaking countries of the world. |
| તારીખ | |
| સ્રોત | પોતાની રચના, data from English dialects1997.png |
| લેખક | M. W. Toews |
| અન્ય આવૃત્તિઓ | English dialects1997.png |
| SVG genesis | |
| Source code | R codedat <- c(USA=226710, UK=56990, Canada=19700, Australia=15316, Other=18581)
col <- c("wheat", "plum", "tomato", "darkseagreen", "maroon")
or <- rev(order(dat))
pdf("English_dialects1997.pdf", height=4, width=4)
par(mar=rep(0,4))
pie(dat[or], init.angle=90, clockwise=TRUE, col=col[or])
dev.off()
|
પરવાના
This file is licensed under the Creative Commons Attribution-Share Alike 4.0 International license.
- તમે મુક્ત છો:
- વહેંચવા – નકલ કરવા, વિતરણ કરવા અને રચનાઓ મોકલવા
- રીમિક્સ કરવા કે મઠારવા – રચના અપનાવવા
- નીચેની શરત હેઠળ:
- આરોપણ – તમારે આ રચનાનો ઉપયોગ કરવા માટે લેખક કે પ્રકાશન અધિકાર ધારકની યોગ્ય માહિતી, પરવાનગી (લાયસન્સ)ની કડી અને તેમાં ફેરફાર કર્યો હોય તો તેનો ઉલ્લેખ કરવો જ પડશે. તમે આ સત્તા અનુસાર જ આ રચનાનો પ્રયોગ થવો જોઈએ, પણ તેઓ તમને અથવા તમારા ઉપયોગ સાથે સંમત થાય છે તે રીતે નહીં.
- શેર- અલાઈક (બિન ભેદભાવ વહેંચણી) – તમે જો આ રચનાને બદલશો, તેમાં ફેરફાર કરશો અથવા તેના પર આધારિત કોઇ કાર્ય બનાવશો તો તમારે પરિણામી કાર્યને તે જ અથવા અનુરૂપ પરવાનગી હેઠળ જ પ્રકાશિત કરવું પડશે.
The document was modified slightly in Adobe Illustrator, then re-saved with Inkscape.
| This SVG file shows a very simple image. Drawing uncomplicated graphics with a text editor seems more adequate than using a vector graphics program, and will often result in a dramatic reduction of file size. |
ફાઇલનો ઇતિહાસ
તારીખ/સમય ઉપર ક્લિક કરવાથી તે સમયે ફાઇલ કેવી હતી તે જોવા મળશે.
| તારીખ/સમય | લઘુચિત્ર | પરિમાણો | સભ્ય | ટિપ્પણી | |
|---|---|---|---|---|---|
| વર્તમાન | ૦૦:૧૦, ૧૯ ઓક્ટોબર ૨૦૨૦ | | ૨૬૯ × ૨૬૦ (૧૨ KB) | Tofeiku | File uploaded using svgtranslate tool (https://svgtranslate.toolforge.org/). Added translation for ms. |
| ૦૦:૩૨, ૧૦ જુલાઇ ૨૦૦૭ |  | ૨૬૯ × ૨૬૦ (૧૨ KB) | Mwtoews | == Summary == See Image:English dialects1997.png for information regarding the figure. Created in R, using (roughly): <pre> dat <- c(USA=226710, UK=56990, Canada=19700, Australia=15316, Other=18581) col <- c("wheat", "pl |
ફાઇલનો વપરાશ
આ ફાઇલને કોઇ પાનાં વાપરતા નથી.
ફાઇલનો વ્યાપક ઉપયોગ
નીચેની બીજી વિકિઓ આ ફાઈલ વાપરે છે:
- cs.wikipedia.org પર વપરાશ
- en.wikipedia.org પર વપરાશ
- en.wikibooks.org પર વપરાશ
- en.wikiversity.org પર વપરાશ
- es.wikipedia.org પર વપરાશ
- hi.wikipedia.org પર વપરાશ
- hr.wikipedia.org પર વપરાશ
- incubator.wikimedia.org પર વપરાશ
- ja.wikipedia.org પર વપરાશ
- ko.wikipedia.org પર વપરાશ
- no.wikipedia.org પર વપરાશ
- pa.wikipedia.org પર વપરાશ
- pl.wikipedia.org પર વપરાશ
- pl.wiktionary.org પર વપરાશ
- sh.wikipedia.org પર વપરાશ
- simple.wikipedia.org પર વપરાશ
- sv.wikibooks.org પર વપરાશ
- ta.wikipedia.org પર વપરાશ
- tr.wikipedia.org પર વપરાશ
- uk.wikipedia.org પર વપરાશ
- uz.wikipedia.org પર વપરાશ
- zh-yue.wikipedia.org પર વપરાશ
- zh.wikipedia.org પર વપરાશ