ચિત્ર:Standard Normal Distribution.png

આ પૂર્વાવલોકનનું કદ: ૮૦૦ × ૪૯૪ પિક્સેલ. અન્ય આવર્તનો: ૩૨૦ × ૧૯૮ પિક્સેલ | ૬૪૦ × ૩૯૬ પિક્સેલ | ૧,૦૨૪ × ૬૩૩ પિક્સેલ | ૧,૨૮૦ × ૭૯૧ પિક્સેલ | ૨,૫૬૦ × ૧,૫૮૨ પિક્સેલ | ૫,૯૮૬ × ૩,૭૦૦ પિક્સેલ.
મૂળભુત ફાઇલ (૫,૯૮૬ × ૩,૭૦૦ પીક્સલ, ફાઇલનું કદ: ૭૫૨ KB, MIME પ્રકાર: image/png)

|
This math image could be re-created using vector graphics as an SVG file. This has several advantages; see Commons:Media for cleanup for more information. If an SVG form of this image is available, please upload it and afterwards replace this template with
{{vector version available|new image name}}.
It is recommended to name the SVG file “Standard Normal Distribution.svg”—then the template Vector version available (or Vva) does not need the new image name parameter. |
સારાંશ:
| વર્ણન |
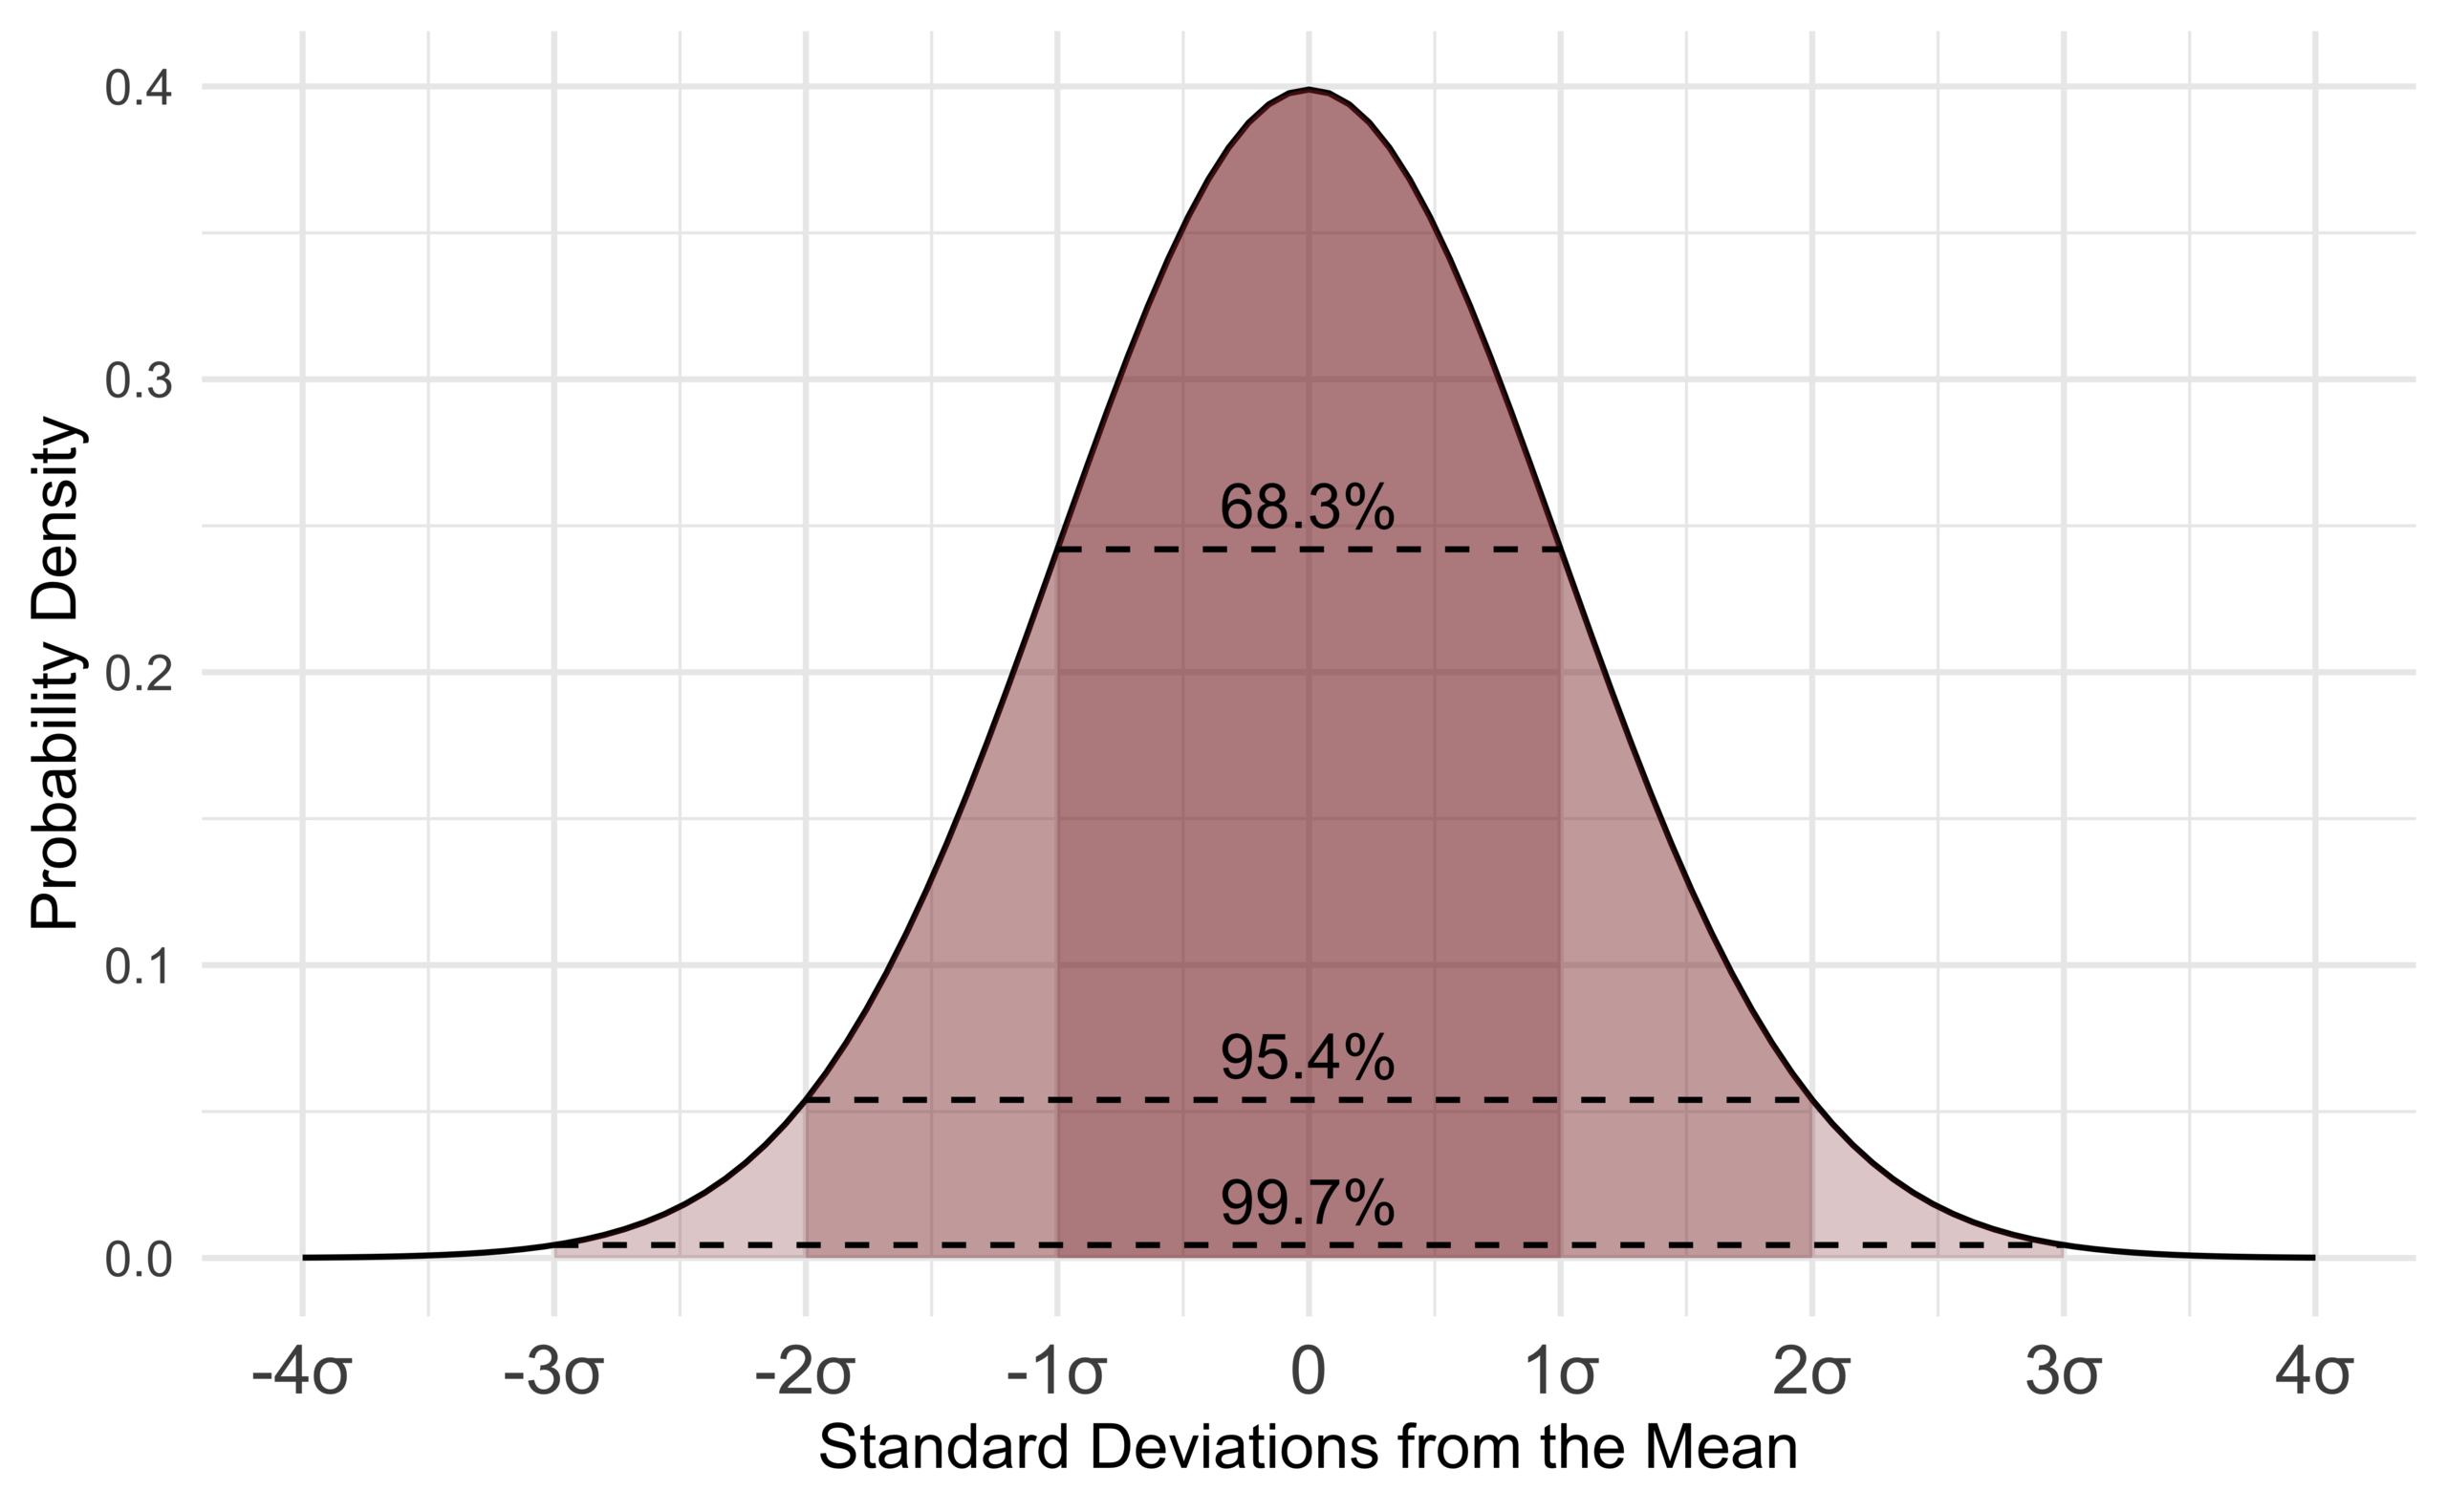
English: The Standard Normal Probability Distribution with shaded regions |
| તારીખ | |
| સ્રોત | પોતાની રચના |
| લેખક | D Wells |
| અન્ય આવૃત્તિઓ |
[]
|


<code><code><code><languages/></code></code></code>
પરવાના
હું, આ કાર્યનો પ્રકાશનાધિકાર ધારક, તેને નીચેના પરવાના હેઠળ અહીં પ્રકાશીત કરૂં છું:
This file is licensed under the Creative Commons Attribution-Share Alike 4.0 International license.
- તમે મુક્ત છો:
- વહેંચવા – નકલ કરવા, વિતરણ કરવા અને રચનાઓ મોકલવા
- રીમિક્સ કરવા કે મઠારવા – રચના અપનાવવા
- નીચેની શરત હેઠળ:
- આરોપણ – તમારે આ રચનાનો ઉપયોગ કરવા માટે લેખક કે પ્રકાશન અધિકાર ધારકની યોગ્ય માહિતી, પરવાનગી (લાયસન્સ)ની કડી અને તેમાં ફેરફાર કર્યો હોય તો તેનો ઉલ્લેખ કરવો જ પડશે. તમે આ સત્તા અનુસાર જ આ રચનાનો પ્રયોગ થવો જોઈએ, પણ તેઓ તમને અથવા તમારા ઉપયોગ સાથે સંમત થાય છે તે રીતે નહીં.
- શેર- અલાઈક (બિન ભેદભાવ વહેંચણી) – તમે જો આ રચનાને બદલશો, તેમાં ફેરફાર કરશો અથવા તેના પર આધારિત કોઇ કાર્ય બનાવશો તો તમારે પરિણામી કાર્યને તે જ અથવા અનુરૂપ પરવાનગી હેઠળ જ પ્રકાશિત કરવું પડશે.
Source code
library(ggplot2)
p <- ggplot(NULL, aes(c(-4,4))) +
  geom_line(stat = "function", fun = dnorm) +
  geom_area(stat = "function", fun = dnorm, fill = scales::muted("blue"), xlim=c(-1,1), alpha=1/4) +
  geom_area(stat = "function", fun = dnorm, fill = scales::muted("blue"), xlim=c(-2,2), alpha=1/4) +
  geom_area(stat = "function", fun = dnorm, fill = scales::muted("blue"), xlim=c(-3,3), alpha=1/4) +
  theme_minimal() +
  theme(axis.text.x = element_text(size = 12)) +
  scale_x_continuous(labels = label_units, breaks = -4:4) +
  xlab("Standard Deviations from the Mean") +
  ylab("Probability Density") +
  geom_segment(aes(x=-1, xend=1, y=dnorm(1), yend=dnorm(1)), linetype="dashed") +
  geom_segment(aes(x=-2, xend=2, y=dnorm(2), yend=dnorm(2)), linetype="dashed") +
  geom_segment(aes(x=-3, xend=3, y=dnorm(3), yend=dnorm(3)), linetype="dashed") +
  annotate("text", x = 0, y = dnorm(1)+0.015, label = "68.3%") + #pnorm(1)-pnorm(-1) %
  annotate("text", x = 0, y = dnorm(2)+0.015, label = "95.4%") +
  annotate("text", x = 0, y = dnorm(3)+0.015, label = "99.7%")

ggsave("Normal_Distribution.png", p, width = 3.7*1.618, height = 3.7, dpi = 1000)
ફાઇલનો ઇતિહાસ
તારીખ/સમય ઉપર ક્લિક કરવાથી તે સમયે ફાઇલ કેવી હતી તે જોવા મળશે.
| તારીખ/સમય | લઘુચિત્ર | પરિમાણો | સભ્ય | ટિપ્પણી | |
|---|---|---|---|---|---|
| વર્તમાન | ૨૩:૫૫, ૨૪ જૂન ૨૦૧૯ | | ૫,૯૮૬ × ૩,૭૦૦ (૭૫૨ KB) | D Wells | User created page with UploadWizard |
ફાઇલનો વપરાશ
આ ફાઇલને કોઇ પાનાં વાપરતા નથી.
ફાઇલનો વ્યાપક ઉપયોગ
નીચેની બીજી વિકિઓ આ ફાઈલ વાપરે છે:
- ar.wikipedia.org પર વપરાશ
- ast.wikipedia.org પર વપરાશ
- as.wikipedia.org પર વપરાશ
- az.wikipedia.org પર વપરાશ
- bcl.wikipedia.org પર વપરાશ
- bg.wikipedia.org પર વપરાશ
- bn.wikipedia.org પર વપરાશ
- br.wikipedia.org પર વપરાશ
- cbk-zam.wikipedia.org પર વપરાશ
- cy.wikipedia.org પર વપરાશ
- el.wikipedia.org પર વપરાશ
- en.wikipedia.org પર વપરાશ
- eo.wikiquote.org પર વપરાશ
- frr.wikipedia.org પર વપરાશ
- fr.wikipedia.org પર વપરાશ
- haw.wikipedia.org પર વપરાશ
- hif.wikipedia.org પર વપરાશ
- ia.wikipedia.org પર વપરાશ
- incubator.wikimedia.org પર વપરાશ
- it.wikipedia.org પર વપરાશ
- ja.wikipedia.org પર વપરાશ
- kab.wikipedia.org પર વપરાશ
- kl.wikipedia.org પર વપરાશ
- ku.wikipedia.org પર વપરાશ
- my.wikipedia.org પર વપરાશ
- qu.wikipedia.org પર વપરાશ
- ru.wikipedia.org પર વપરાશ
- simple.wikipedia.org પર વપરાશ
- sq.wikipedia.org પર વપરાશ
- tl.wikipedia.org પર વપરાશ
- tr.wikipedia.org પર વપરાશ
- tum.wikipedia.org પર વપરાશ
- www.wikidata.org પર વપરાશ
- zh-yue.wikipedia.org પર વપરાશ
- zu.wikipedia.org પર વપરાશ